About Dataset
B2B Lead Scoring Dataset — Advanced Tier
This is a synthetic dataset for practicing B2B lead scoring. It was generated by leadforge, an open-source Python framework for producing realistic CRM/funnel training data. No real company, customer, or transaction is represented.
What you are predicting: Each row is a sales lead at a fictional B2B SaaS company. The task is binary classification:
converted_within_90_days— did this lead close as a paid deal within 90 days?
Features capture the first 30 days of CRM activity per lead (email/call touches, product sessions, deal stage, account firmographics). The label is derived from simulated events — never directly sampled — so there is genuine causal structure behind the signal.
This tier: advanced
| Property | Value |
|---|---|
| Conversion rate | ~8% |
| Signal strength | 0.50 / 1.0 (moderate) |
| Noise level | 0.55 / 1.0 (high) |
| Missing values | ~18% |
| LR AUC (test, 5-seed median) | 0.624 |
| GBM AUC (test, 5-seed median) | 0.600 |
| Average precision (LR) | 0.122 |
| Precision @100 | 0.11 |
The advanced tier is a calibration and rare-event exercise. Conversion rate is ~8% —
a realistic low-prevalence regime for mid-market SaaS — and noise is heavy enough that
count features show artifact zeros (Gaussian noise clamped to zero; treat zero clusters as
data-cleaning material, not reliable signal). AUC barely moves across tiers by design;
here you'll want average precision, P@K, and value-weighted ranking
(expected_acv × P(convert)) to measure what matters. Calibration is harder in this
tier: a miscalibrated model can rank correctly but still predict systematically wrong
probabilities — the kind of mistake that breaks real-world decision thresholds.
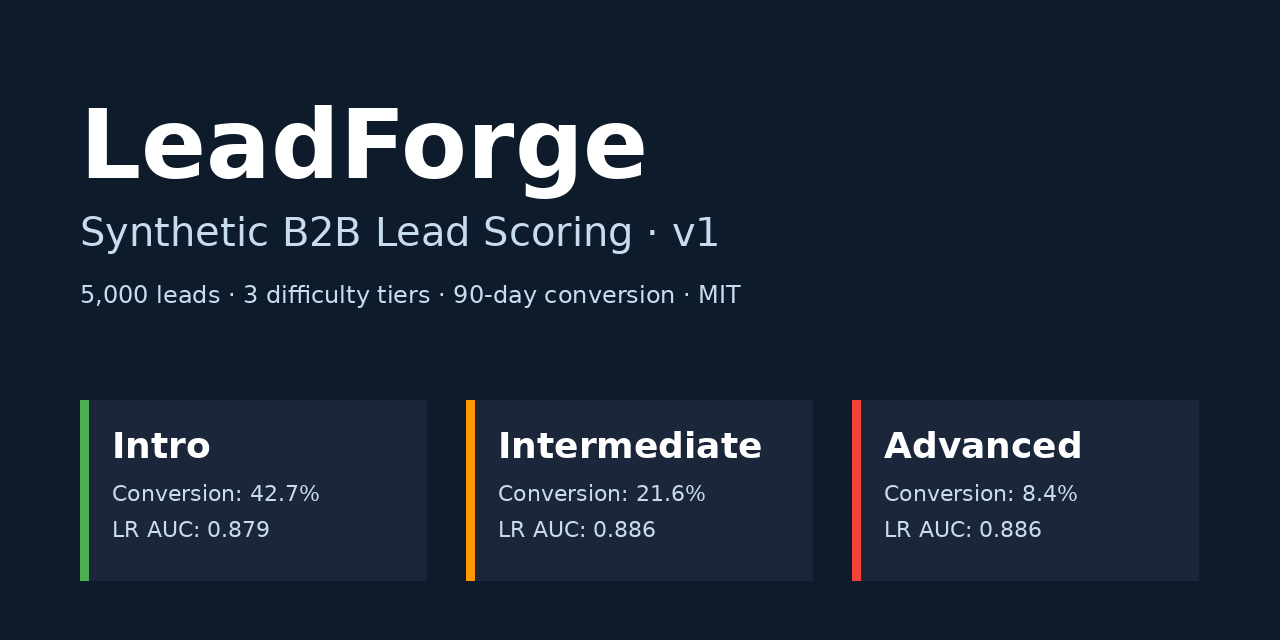
This dataset ships in three tiers — intro → intermediate → advanced — with decreasing signal, lower conversion rates, and heavier noise and missingness. All three tiers share the same schema and simulate the same fictional B2B world.
Table inventory
| Table | Rows | Description |
|---|---|---|
| accounts | 1,500 | One row per company |
| contacts | 4,200 | One row per buyer-side individual (multiple per account) |
| leads | 5,000 | One row per lead — the prediction unit |
| touches | 38,208 | Marketing / SDR outreach events (first 30 days per lead) |
| sessions | 9,942 | Product demo or trial sessions (first 30 days per lead) |
| sales_activities | 19,995 | CRM activities: calls, emails, meetings (first 30 days per lead) |
| opportunities | 4,004 | Deal records opened before the 30-day snapshot |
Snapshot-safe: event tables contain only rows with timestamps ≤ 30 days from lead
creation. Outcome columns (converted_within_90_days, conversion_timestamp,
close_outcome) are excluded from the public relational tables — they appear only in the
task splits.
Features
| Category | Columns | Examples |
|---|---|---|
| Account | 6 | account_id, industry, region |
| Contact | 4 | contact_id, role_function, seniority |
| Lead metadata | 3 | lead_id, lead_created_at, lead_source |
| Engagement | 11 | touch_count, inbound_touch_count, outbound_touch_count |
| Sales | 6 | activity_count, days_since_last_touch, opportunity_created |
| Target | 1 | converted_within_90_days |
⚠ Intentional leakage trap: total_touches_all aggregates touches over the full
90-day window (not just the 30-day feature window) and is deliberately retained as a
leakage-detection teaching exercise. It is flagged leakage_risk=True in
feature_dictionary.csv. Drop it from your feature set unless you are studying leakage.
See feature_dictionary.csv for the full column-by-column specification.
The simulated world
The dataset simulates a fictional company — Veridian Technologies — a Series B startup (Austin, TX, founded 2017) selling Veridian Procure, a cloud procurement / AP automation SaaS. Everything below is invented:
- Target customers: 200–2,000-employee firms in the US and UK (manufacturing, logistics, healthcare, professional services)
- Deal range: $18,000–$120,000 ACV; average deal $42,000; average sales cycle 45 days
- Go-to-market: 45% inbound marketing, 35% SDR outbound, 20% partner referrals
- Buyer personas: VP Finance (economic buyer), AP Manager (champion), IT Director (technical evaluator), Procurement Manager (end user)
In this public version, the hidden causal graph, latent trait scores, and mechanism parameters are withheld. The instructor companion bundle includes them.
How to load
import pandas as pd

# Flat CSV — all leads, all splits combined (convenient for exploration)
df = pd.read_csv("lead_scoring.csv")
X = df.drop(columns=["converted_within_90_days"])
y = df["converted_within_90_days"]

# Parquet task splits — recommended for model training
train = pd.read_parquet("tasks/converted_within_90_days/train.parquet")
valid = pd.read_parquet("tasks/converted_within_90_days/valid.parquet")
test  = pd.read_parquet("tasks/converted_within_90_days/test.parquet")

# Relational tables — for feature engineering
leads   = pd.read_parquet("tables/leads.parquet")
touches = pd.read_parquet("tables/touches.parquet")
Splits are 70 / 15 / 15 (train / valid / test), stratified on the target, deterministic given seed 42.
Note on account overlap: ~93% of test-set accounts also appear in the training set
(splits are keyed on lead_id). Headline AUC overstates generalisation to unseen
accounts. For a faithful out-of-sample estimate, use
GroupKFold(groups=df["account_id"]).
Reproducibility
Generated with leadforge v1.0.0, recipe b2b_saas_procurement_v1, seed 42,
difficulty advanced. To reproduce:
pip install leadforge
leadforge generate --recipe b2b_saas_procurement_v1 --seed 42 \
                   --mode student_public --difficulty advanced --out my_bundle
Every file in this bundle is SHA-256 hashed in manifest.json. Run
leadforge validate my_bundle to verify integrity.
Author: Shay Palachy Affek · Kaggle · GitHub
Caveats
- Synthetic data only. No real company, customer, or market is represented.
- AUC does not distinguish tiers. LR AUC is ~0.62 in this tier — similar to the other two tiers. The tiers differ in conversion rate (43% / 22% / 8%), noise, and missing values — not in rank discrimination. Use average precision, P@K, and calibration metrics to see the difficulty gradient.
- Artifact zeros in count/duration features. Gaussian noise is applied before MCAR
missingness; values clamped below zero to zero. Suspicious zero clusters in count
features (e.g.
days_since_last_touch = 0) may be noise artifacts rather than genuine zero values — treat them as intentional data-cleaning material. - ~93% train/test account overlap. Splits are keyed on
lead_id; most test accounts also appear in train. Headline metrics overstate generalisation to unseen accounts. - Snapshot window. Engagement features cover days 0–30 per lead; the label resolves
at day 90.
total_touches_allis the intentional exception — it aggregates over the full 90-day window and is a leakage trap. - Public version. The hidden causal graph, latent trait scores, and mechanism parameters are withheld. The instructor companion bundle includes them.